Impacts of urbanization on vegetation phenology over the past three decades in Shanghai, China
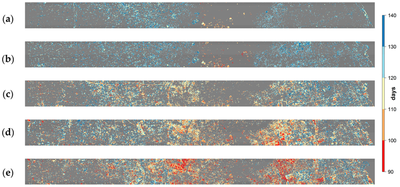
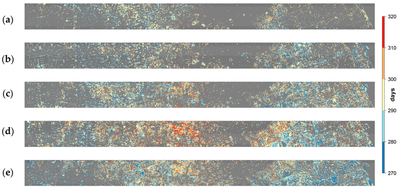
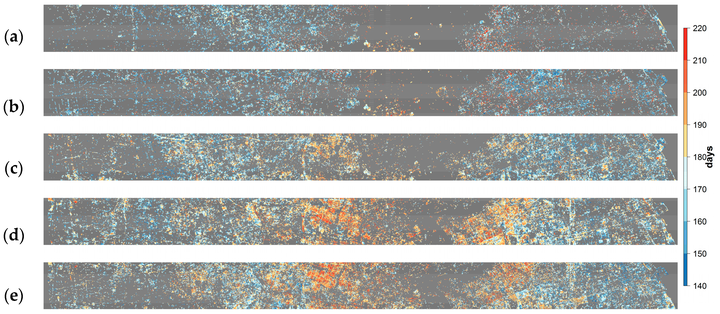 Title: Spatial pattern of the mean length of season for urban vegetation along the east-west transect for the five time periods: a. 1984-1995; b. 1996-2000; c. 2001-2005; d. 2006-2010; e. 2011-2015.
Abstract
Vegetation phenology manifests the rhythm of annual plant life activities. It has been extensively studied in natural ecosystems. However, major knowledge gaps still exist in understanding the impacts of urbanization on vegetation phenology. This study addresses two questions to fill the knowledge gaps. First, how does vegetation phenology vary spatially and temporally along a rural to urban transect in Shanghai, China, over the past three decades? Second, how do landscape composition and configuration affect those variations of vegetation phenology? To answer these questions, 30 m by 30 m mean vegetation phenology metrics, including the start of growing season (SOS), end of growing season (EOS), and length of growing season (LOS), were derived for urban vegetation using dense stacks of enhanced vegetation index (EVI) time series from images collected by Landsat 5, 7, and 8 satellites from 1984 to 2015. Landscape pattern metrics were calculated using high spatial resolution aerial photos. We then used Pearson correlation analysis to quantify the associations between phenology patterns and landscape metrics. We found that vegetation in urban centers experienced advances of SOS for 5 to 10 days and delays of EOS for 5 to 11 days compared with those located in the surrounding rural areas. Additionally, we observed strong positive correlations between landscape composition (percentage of landscape area) of developed land and LOS of urban vegetation. We also found that the landscape configuration of local land cover types, especially patch density and edge density, was significantly correlated with the spatial patterns of vegetation phenology. These results demonstrate that vegetation phenology in the urban area is significantly different from its rural surroundings. These findings have implications for urban environmental management, ranging from biodiversity protection to public health risk reduction
Key Innovations
Landsat-scale phenology maps have only recently been applied to urban areas, and there remains substantially unrealized potential for leveraging them to better understand how urbanization affects phenological changes. Landscape patterns not only reflect the urban development and their socioeconomic drivers, but also significantly influence UHI. However, the relationship between landscape pattern and vegetation phenology is poorly understood. This research aims to investigate the impacts of urbanization as well as urban landscape composition and configuration on vegetation phenology from 1984 to 2015 in Shanghai, China.
Research Highlights
- Multi-year average Landsat-scale Phenology metrics were derived in Shanghai
- Vegetation in urban centers experienced advanced SOS and delayed EOS
- Landscape composition, i.e. edge density and patch density, affect vegetation phenology
- More impervious surface advance SOS and delay EOS while more green space have the opposite effect.
Key findings
Following figures present images showing the Landsat scale timing of start of season and end of season for forest land along East-West transect over the five time intervals (the gray areas are non-forest lands and missing data). They clearly shows that the phenology cycle in the urban centers starts earlier, and ends later when compared with the surrounding rural regions.
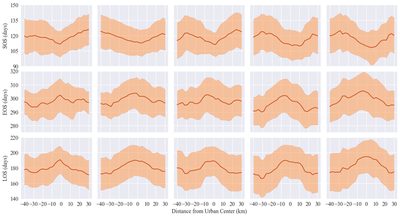
The figure shows the mean and standard deviation the phenological metrics along the transect. Average SOS occurs 5-10 days earlier and EOS delayed about 5-11 days, causing LOS to be longer about 10-21 days in urban centers compared with rural regions. However, the spatial heterogeneities in the urban environments caused substantial localized variations in SOS, EOS, and LOS. It exhibits that the local variation can be up to 10 days.