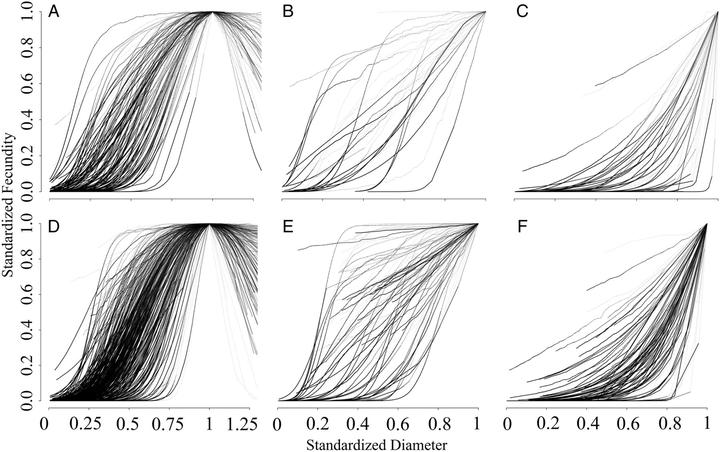
 Title: The relationship between fecundity and diameter for species in temperate (A–C) and tropical (D–F) regions, respectively. A and D exhibit type A species (fecundity eventually declines); B and E show type B species (sigmoid increase in fecundity); C and F represent type C species (continuous increase in fecundity). Line transparency is proportional to the 90% credible interval width across the diameter ranges, such that confident predictions are opaque, and vice versa. The percentages of species for each type of fecundity–diameter relationship are summarized in Table 1. Dopt is the diameter when maximum fecundity occurs.
Abstract
Despite its importance for forest regeneration, food webs, and human economies, changes in tree fecundity with tree size and age remain largely unknown. The allometric increase with tree diameter assumed in ecological models would substantially overestimate seed contributions from large trees if fecundity eventually declines with size. Current estimates are dominated by overrepresentation of small trees in regression models. We combined global fecundity data, including a substantial representation of large trees. We compared size–fecundity relationships against traditional allometric scaling with diameter and two models based on crown architecture. All allometric models fail to describe the declining rate of increase in fecundity with diameter found for 80% of 597 species in our analysis. The strong evidence of declining fecundity, beyond what can be explained by crown architectural change, is consistent with physiological decline. A downward revision of projected fecundity of large trees can improve the next generation of forest dynamic models.
Research Highlights
- Tree fecundity declines in 80% of the 597 species we examined
- Two allometric scaling models cannot explain why fecundity decline in large and old trees
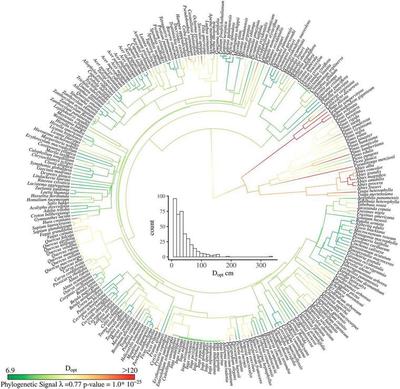
- The diameter when the maximum fecundity occurs is phylogenetically conserved
- The fact that 20% of the species not showing fecundity decline is due to lack of large trees in the dataset
Allometric scaling
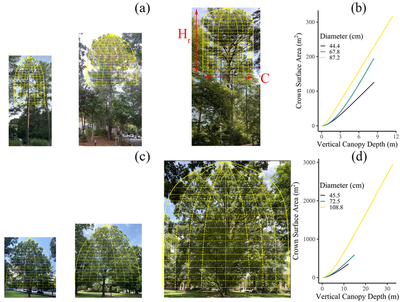
We cannot reject allometric scaling because fecundity might scale with diameter in a different way. To fully evaluate allometric explanations, including whether or not alternative assumptions could explain declines with size, we examined scaling with crown surface area and crown depth, due to their connection to light availability:
Phylogenetic signal
Phylogenetic analysis might provide insight into the pervasiveness of fecundity declines with size. The noisier the data, the more difficult it becomes to estimate the additional parameters that are needed to describe changes in the fecundity relationship with size. We thus expect that noise alone will preclude finding size-related change in some species, depending on sample size and non–size-related variation. If the vagaries of noisy data and the distribution of diameters preclude estimation of declines in some species, then we do not expect that phylogeny will explain which species do and do not show these declines. Rather than phylogeny, this explanation would instead be tied to sample size and the distribution of diameter data. Conversely, phylogenetic conservatism, i.e., a tendency for declines to be clustered in related species, could suggest that fecundity declines are real.